Community stability
Introduction
Community stability is an important ecological measurement as it provides indications of not just a few selected species but several (or occasionally all) species living together in the community. Thus ecologists can gather information concerning the overall stability of a community under various environmental responses. Just as with our last practical we will be considering stability from a temporal perspective. The other stability perspective one could consider is spatial stability. Here ecologists consider the variation in community responses across a landscape at single time intervals. This approach helps ecologists to understand how communities functiona and respond given underlying resource gradients. This is very cool but these kinds of studies are less common and so we will skip over them today.
There are several measurements of community temporal stability but the ones which we will be dealing with today will be biomass production stability and species turnover and asynchrony.
Biomass produciton stability
Biomass production stability is a measure of the regularity (again using the coefficient of variation \(\left( CV = \frac{\overline{x}}{\sigma}\right)\)) with which a community produces biomass. As this is a temporal measurement the \(CV\) parameters will be made up of measurements through time - much like what we did in our last practical for the environmental stochaticity section. So here a high \(CV\) suggests that the mean biomass produciton (\(\overline{x}\)) is relatively high and the standard deviation (\(\sigma\)) is relatively low.
Speciesasynchrony
This is a bit more of a trikcy concept to take in but it is incredibly important for any study considering community stabiltiy. Biomass prodction stability is generally based on one measurement at each time-period for each given plot in an experiment. On the other hand, species asynchrony is based on several measurements at each time period in a given plot and is thus a more intensive kind of data to collect. What it attempts to capture though is the co-variation in species composition through time. High co-variation suggests low asynchrony and high synchrony - that is the species that make up the community increase with one another and decrease with one another. This plot (modified from this article) gives a great description of this:
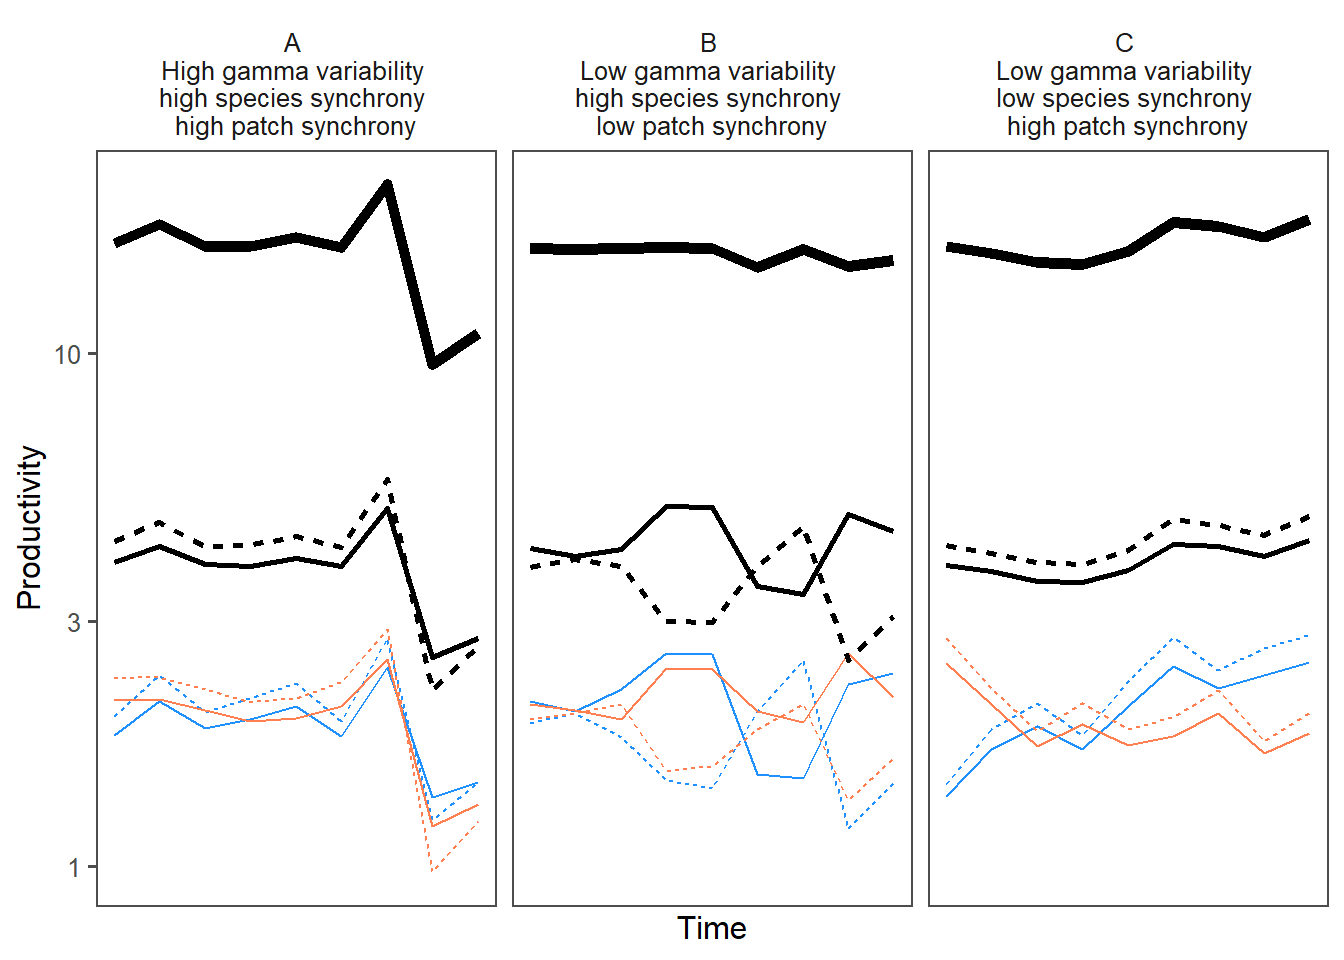
On the other hand if there is high asynchrony then as some species increase other species in the community decrease. There are a few synchrony metrics available but one which is fairly intutive to understand is that developed by Gross (2014). Here syncrony is defined as:
\[\displaystyle \left(\frac{1}{N}\right) \sum_{i = 1} Corr\left(x_i,\sum_{i \ne j}x_j\right)\]
You do not need to understand everything that is going on there (if you are interested have a browse through the paper to get an idea). The important thing is to realise the components that make up this calculation. There is a time parameter (\(t\) or \(T\)), a variation parameter (\(\sigma\)), an individual species abundance parameter (\(x\)), and an overall abundance parameter (\(N\)). As this metric incorporates several parameters the output of this metric can provide a slightly more comprehensive description of the community’s dynamics than biomass production stability can give. The output of this calculation is a value bound between -1 (maximal asynchrony) and 1 (maximal synchrony) with zero suggesting complete independence of species fluctuations - i.e. species within the community are neither cooccurring nor mutually exclusive.
Relationships
The relationships between these metrics and their application to ecology are among some of the most hotly contested topics in ecology. For years ecologists have sought to understand these parameters and how they describe the world around us. The goal of all of this is to better understand how we can promote the sustainibility of our communities under environmental change and anthropogenic disturbances. One of the most commonly suggested relationships between stability and synchrony is with diversity. In the discussion and application questions you will be asked to comment on the likely reasons about why this relationship likely occurs.
Using the same methodology as in Wilcox et al. (2017), the app for today’s practical models the overall (community biomass production stability) and species synchrony for three communities of 2, 4, and 8 species, respectively. There are three parameters available to you to help you explore these relationships. These parameters are the initial population sizes of each of the species in the community, each population’s carrying capacity, and the “Synchrony coefficients” which describe the relationships between two species within the community. Increasing this slider increases the synchrony of the relationship between the two species in question whilst decreasing the slider increases the asynchrony of the two species.
Download the community stability and species synchrony app here
Worksheet questions
Community stability
Question 1
Consider the coefficient of variation equation \(CV = \frac{\overline{x}}{\sigma}\) and discuss under what circumstances one will get very high stability and very low stability by simply manipulating the xbar and sigma parameters (2)
Question 2
Using the app determine which number of species will produce the greatest community stability value where all species have the same initial population sizes, carrying capacities, and synchrony coefficients (4)
Question 3
Describe differences in the shape between the community biomass line (thick black line) when community stability is high and when community stabiltiy is low (4)
Question 4
How does the shape of the individual species productivity lines affect the total community productivity line and in effect the community stability (5)
Species synchrony
Question 1
When synchrony is high between two species what happens to the patterns of the productivity lines for those two species (2)
Question 2
When synchrony is low between two species what happens to the patterns of the productivity lines for those two species (2)
Question 3
Describe the relationship between the number of species and the species asnychrony (5)
Relationship between synchrony and stability
Question 1
Comment on the general relationship between the values of species synchrony and community stability under various numbers of species and population parameters (10)
Coding questions
The figure above based on a figure modified from this publication. In an effort to make their publication entirely reproducible the researchers who wrote the article have made the code for the figure (and all their analyses) freely available as part of their publication. Find out how to access this code and then modify the code to produce a figure resembling the one below (20)
Application questions
Question 1
In your own words, describe what is meant by the term community stability (3)
Question 2
Many external factors can affect ecosystem stability. Identify five factors which can affect ecosystem stability. Provide a primary source reference (i.e. an article reporting the results of an actual experiment rather than a review article) to support each of your factors and briefly describe the mechanism that takes place which results in the destabilisation (5 x 3 = 15)
Question 3
As you might have noticed from the studies you have just identified, a large proportion of studies which have measured community stability have used total plant biomass changes/fluctuations over time. Several researchers feel that this measurement technique is insufficient to capture “total community stability”. There are several other ways that ecologists can measure community stability either by modifying the variables measured or by using different metricies. List and briefly explain four other methods ecologists could use to quantify community stability (8)
Question 4
After reading through this article, describe the mechanism which the authors have proposed behind how species asynchrony stabilises communities (10)