Island biogeography
Introduction
Island biogeography is an important field of ecology which deals with colonisations and extinctions of an insular or island habitat. These types of habitats are not necessarily always surrounded by water as is true for the geographical term but rather the habitat in question can be surrounded by some other terrain or land use type which restricts animal movements to the island.
These kinds of areas are important as many conservation areas can be viewed as islands. The Hluhluwe-Imfolozi Park is an example of an island as there is a fence surrounding the reserve and human settlements, privately owned and managed land and industry along parts of the park’s boundary. Another example could be a coral reef which might be entirely surrounded by open ocean. Tall mountain tops, isolated valleys, and lakes are a few other examples.
Generally, island biogeographers study how the number of species changes between islands. One common reason proposed for the variation in species richness is the size or area of the island - larger islands tend to be able to support more species.
This relationship could be due to variation in
- resources
- habitat structure
- climate
- chance of discovery
which generally co-occurs with changes in area. Because of this we can model changes in species richness as
\[
S = cA^z
\]
where \(S\) is species richness, \(A\) is the size of the island, and \(c\) and \(z\) are constants which produces a relationship as follows
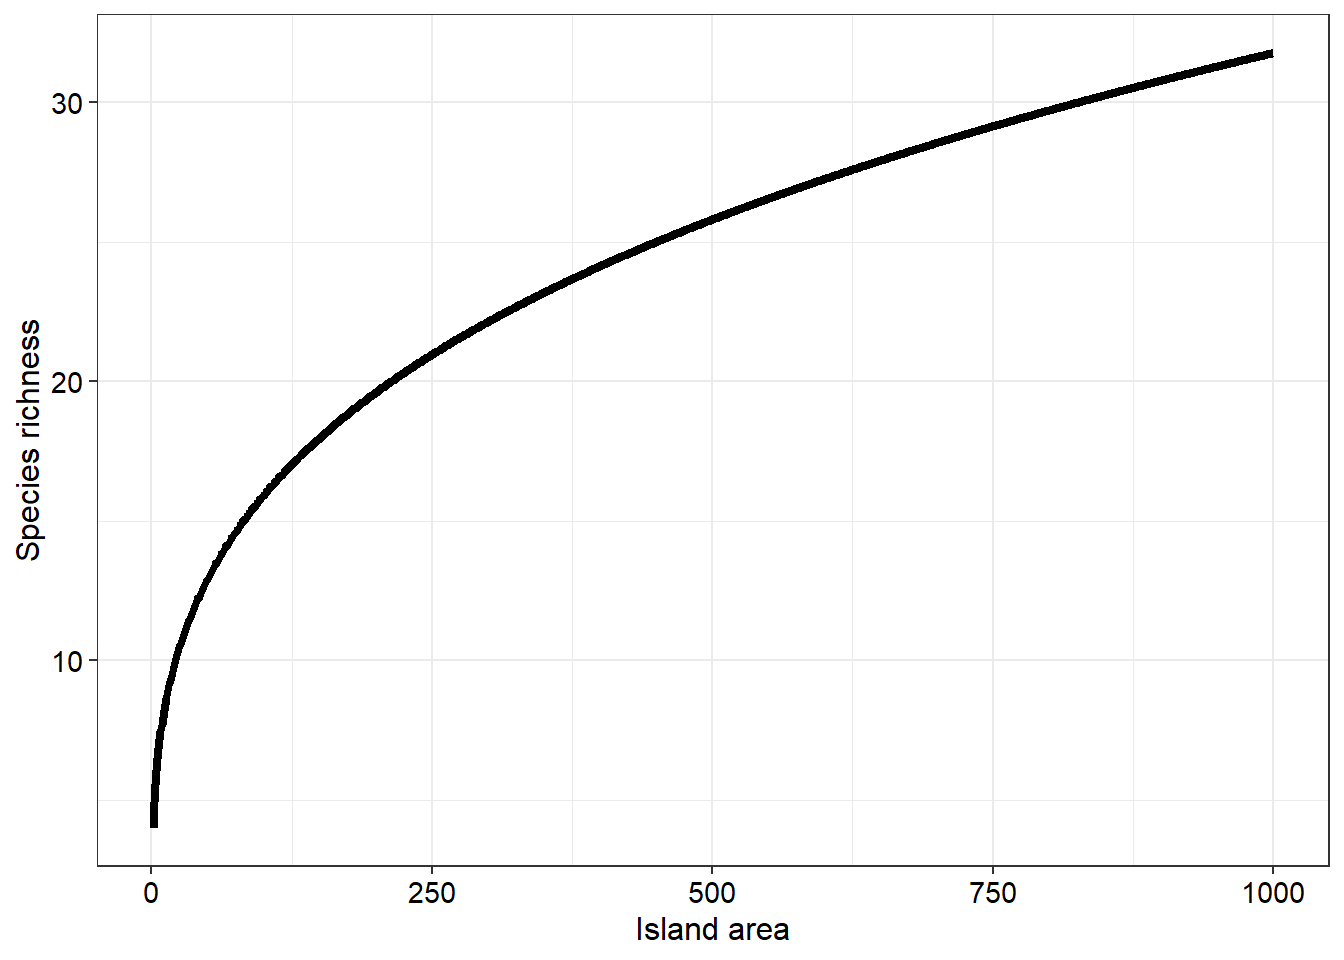
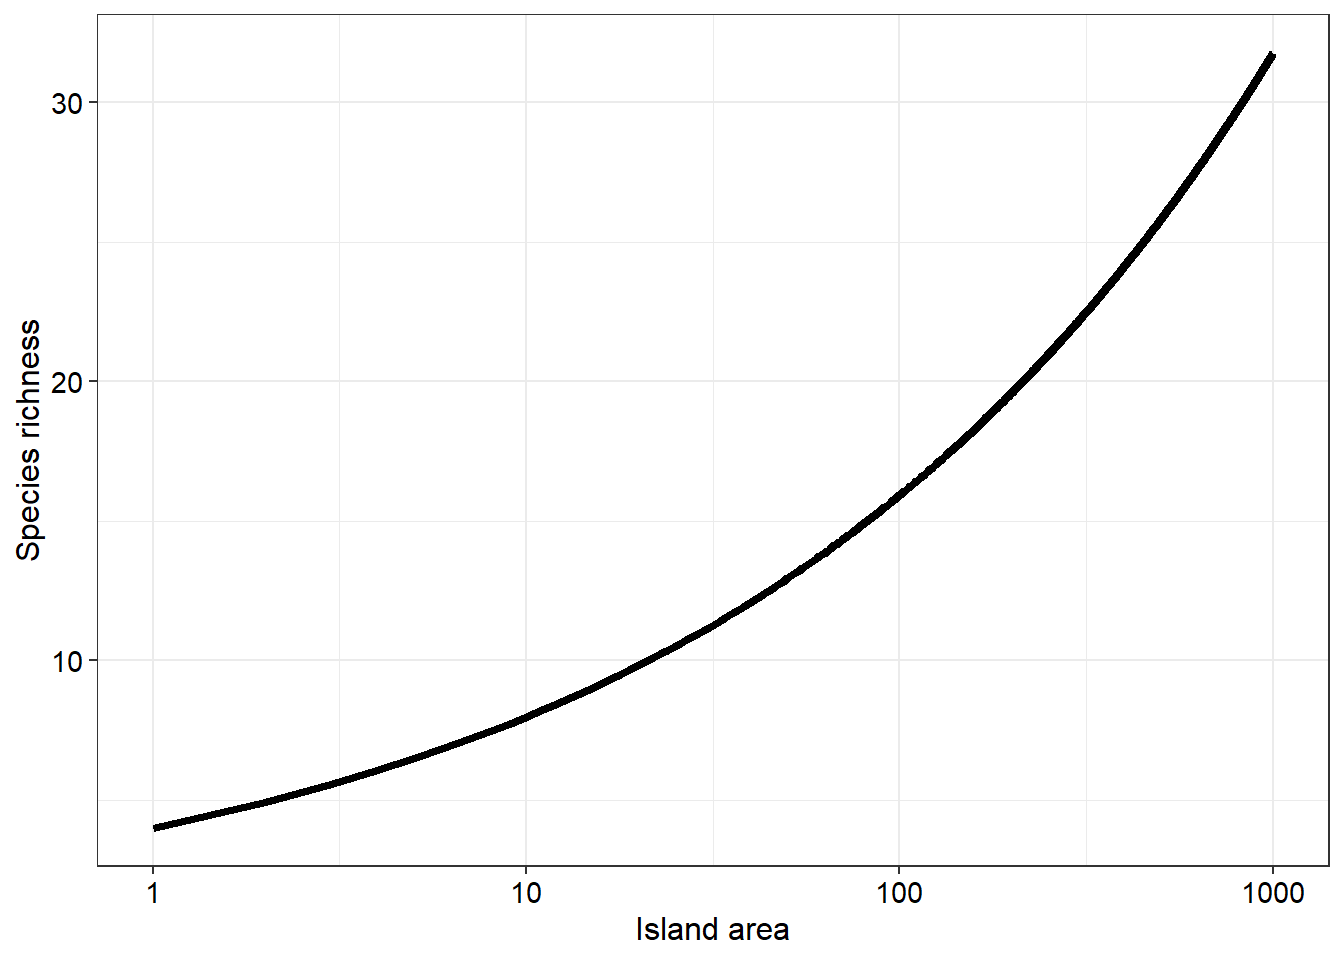
With this example we have low species numbers for small islands whilst many more species tend to inhabit larger islands. However, if we log transform the x axis we will produce a more linear relationship
The species-area relationship provides a solid introduction to island biogeography. However, there are several other elements we will need to explore to further solidify this concept. What we have just simulated is hundreds of islands’ species richnesses to get a high level or global overview of the topic. Suppose we zoom in to one island in particular we can study the arrivals/immigrations and the extinctions of species and attempt to model these dynamics.
In island biogeography species arrive at an island from a “mainland” - an area with a high species pool. Species from this mainland can colonise a given island with an immigration rate \(\lambda_s\) - the number of new species which will arrive on the island per unit time. We will also need to model species losses/extinctions using the extinction rate \(\mu_s\) - the number of species which will go extinct from the island per unit time. Using these two equations we can model the rate of change of species \(S\) as the difference between these two rates
\[ \frac{dS}{dt} = \lambda_S - \mu_S \]
This equation suggests that the change in the number of species changes as the number of species on the island changes. This change results from changes in the immigration and extinction rates under changes in species richness. As islands are finite in size it seems reasonable to suggest that the number of species present on the island will reach a threshold value. Therefore, once the number of species present on the island reaches a maximum, the number of new species occurring will equal zero. Thus the immigration rate decreases as the number of species on the island increases. We can model this using a simple straight line equation
\[ \lambda_S = I - \left(\frac{I}{P}\right)\times S \]
Where \(I\) is the maximum immigration rate (also the y-intercept), \(\frac{I}{P}\) is the rate of change of the immigration rate (the gradient of the straight line) which gives the x-intercept = \(P\) which represents the maximum number of species that can inhabit the island or the total number of species in the species pool.
Using similar thinking we can derrive an equation to describe how \(\mu_S\) changes. Generally, \(\mu\) will increase as the number of species on the island increases, however, we assume that the probability that a species will go extinct is constant between small and large species pools. From this it seems then that the maximum rate (not probability) that species will go extinct (\(E\)) will be when the number of species on the island has reached a maximum (\(P\)). Therefore, we can model \(\mu\) as
\[ \mu_S = \left(\frac{E}{P}\right) \times S \]
Putting these new immigration and extinction rate equations together we can now obtain a more detailed equation to describe the rate of change in species richness
\[ \frac{dS}{dt} = I - \left( \frac{I}{P} \right) \times S - \left( \frac{E}{P} \right) \times S \]
Plotting the result of this equation will give the following outcome
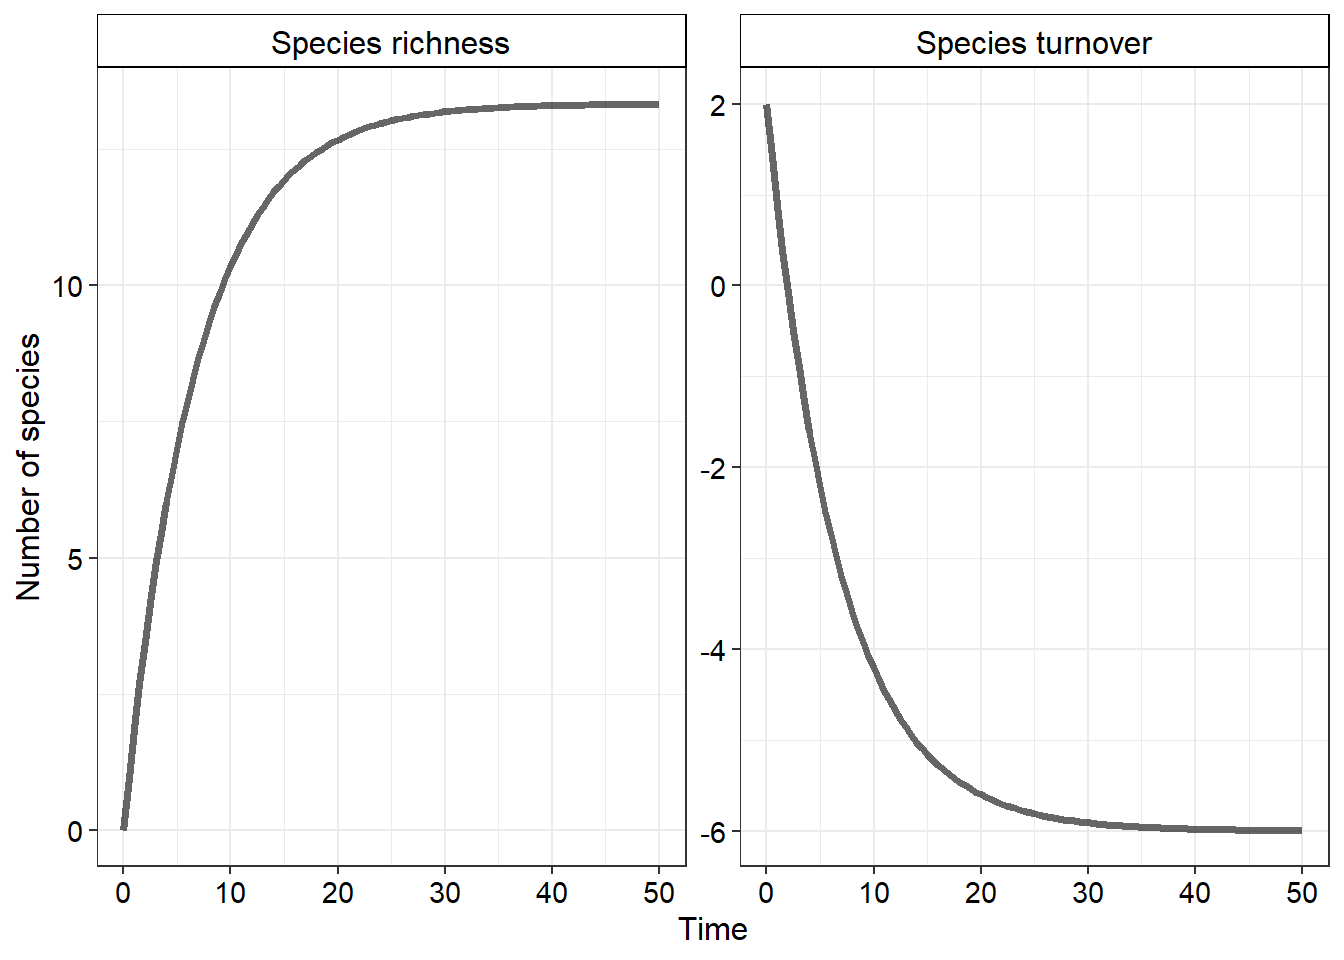
Interestingly, the number of species at equilibrium is quite different to the number of species present on the mainland (\(P\) - the species pool). To understand why this is we will need to explore a new idea.
Species turnover
Species numbers are often used by ecologists as large amounts of information can be inferred based on the number and type of species present. One of our earlier practicals introduced the concept of stochasticity and we leared there how important it is for stability to be maximised particularly when the population is small. Imposing large fluctuations onto a small population could result in extinction if a catestrophic event occurs. Given that we are dealing often with small islands the number of species and individuals of each species is likely to be relatively small.
Under dramatic climatic conditions the number of species present on the island is likely to change quite a lot. One could also imagine a situation where the number of species remains relatively constant but the types of species, and with that the species identities, present on the island varies substantially. This change in species identities is referred to “species turnover”. Low turnover means that the same species are present over and over again whereas the high turnover means that the species that were previously present in the community have become extinct and have been replaced by new species. Another way of describing turnover is the difference between the number of new species arriving on the island and the number of species becoming extinct. Thus turnover can be both positive and negative. Whether the value is positive or negative gives an indication on the direction that the community is heading towards (either large gains or losses of species).
As we have the equations to determine the number of species on an island we can calculate species turnover under varying species richnesses as the difference between the number of immigrations and extinctions. To calculate these we will need to integrate the species immigration and species extinction rate equations and calculate the difference between the results of these two new equations

To determine the equilibrium number of species on the island we can set the rate of change in species richness \(\left(\frac{dS}{dt}\right)\) to zero and solve for \(\hat{S}\) (the number of species at equilibrium) giving
\[ \hat{S} = \frac{IP}{I+E} \]
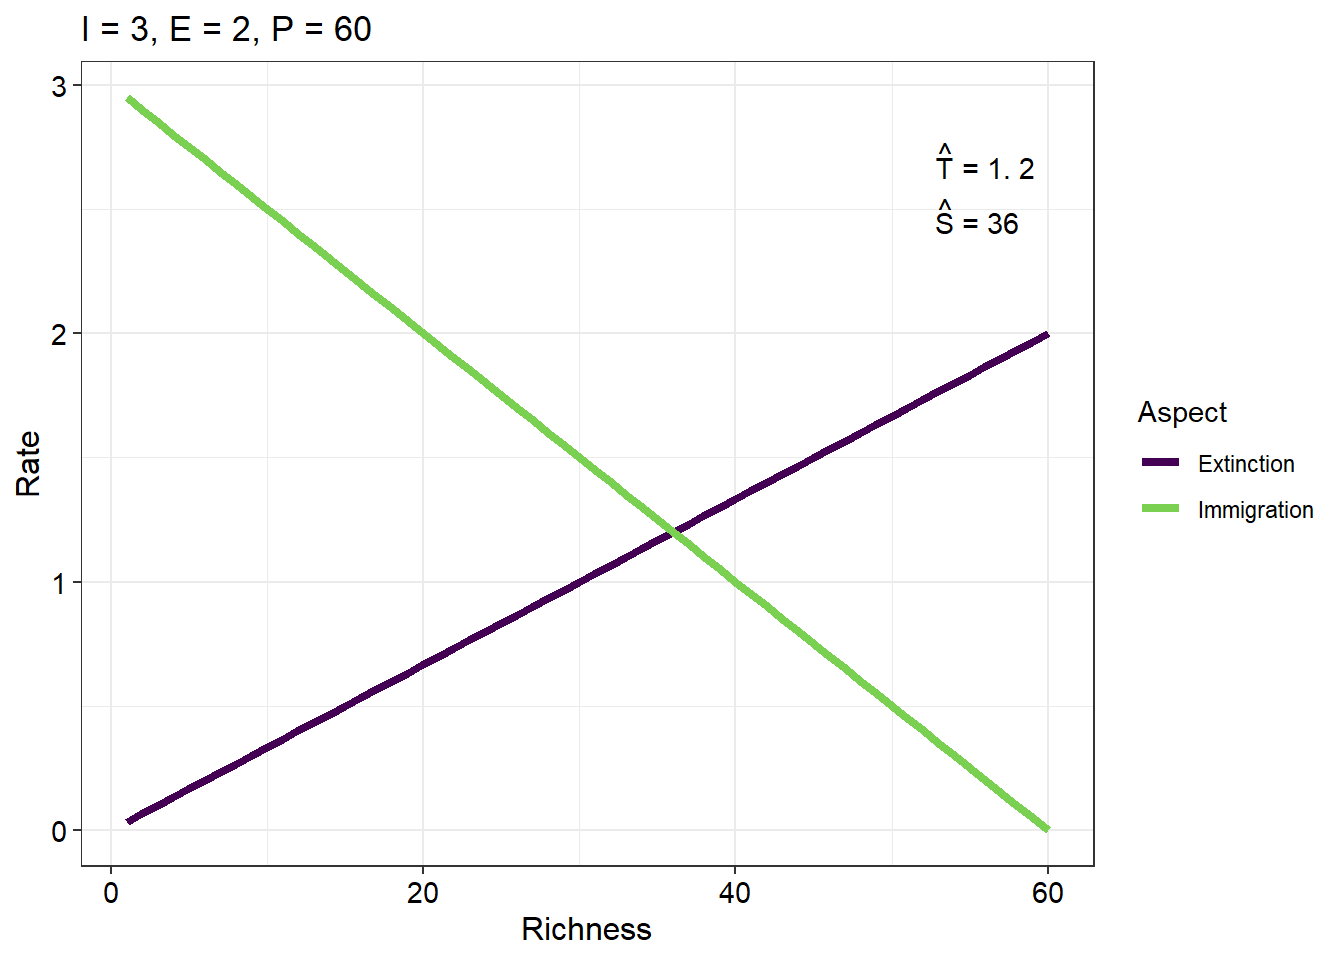
Plotting the rates of immigration and extinction across a gradient of species richness will give
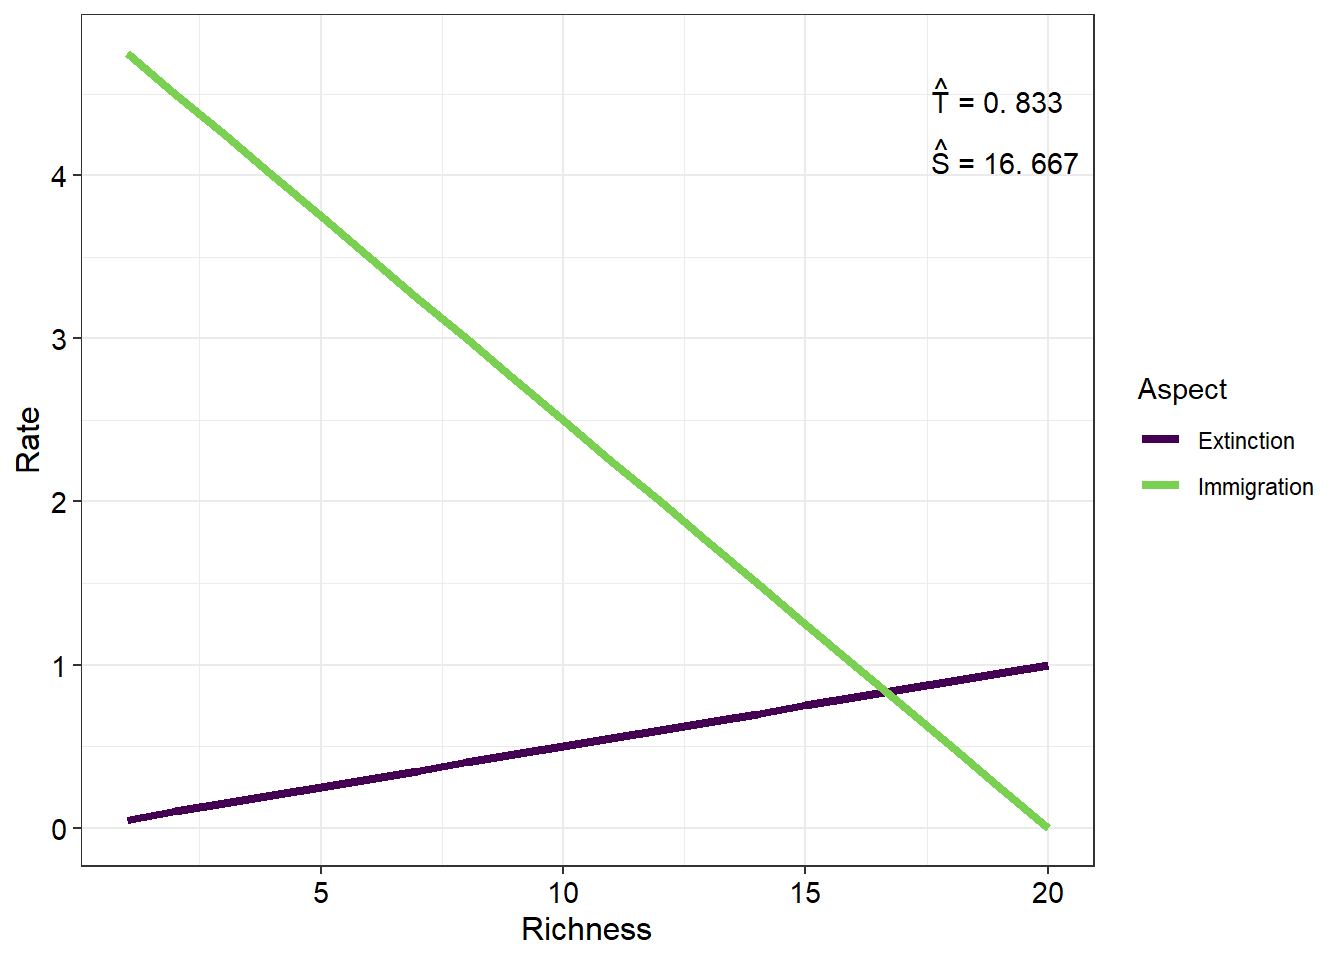
You will notice two important values displayed on this plot. They are the equilibrium values of species richness and species turnover \((\hat{S}\) and \(\hat{t} )\) respectively. To calculate \(\hat{S}\) we simply equate \(\frac{dS}{dt}\) to zero which will simplify to
\[ \hat{S} = \frac{IP}{I+E} \]
This value is equal to the x coordinate of the intersection of the immigration and extinction rate lines. Similarly, \(\hat{t}\) represents the y coordinate of this point of intersection and can be calculated as
\[ \hat{T} = \frac{\left( \frac{IP}{I+E} \right) \times E}{P} \]
Worksheet questions
Species-area relationships
Use the first app (available here) to answer the following questions.
Question 1
Describe how each of the parameters in the app affect the output of the figure (6)
Question 2
Provide three possible factors that could contribute to the \(c\) and \(Z\) parameters (6)
Question 3
Is there a point along the range of \(Z\) where the desired output no longer seems reasonable? (3)
Immigration and extinction rates
Use the second app (available here) to answer the following questions.
Question 1
What units are the immigration and extinction rates measured in? (2)
Question 2
Which axis intercepts do the immigration and extinction rates affect? (4)
Question 3
Explain how and why the equilibrial species turnover metric (\(\hat{T}\)) changes across the rate parameters (5)
Question 4
Explain how and why the equilibrial species richness metric (\(\hat{S}\)) changes across the rate parameters (5)
Question 5
Explain why there is hardly ever a scenario where the number of species in the species pool is equal to the number of species in present on the island at an equilibrial state (6)
Coding questions
When drawing straight lines we do not need to use the geom_line() function from ggplot2. There is a better geom that is designed specifically for plotting straight lines. It is the geom_abline() function. This allows us to specify the y-intercept (\(a\)) and the slope (\(b\)) and then it plots a straight line using those inputs.
Another important feature of ggplot2 is the annotate() function. This takes a string (basically a variable enclosed in quotation marks) an prints it out on the figure at a given set of coordinates. It works in a similar manner to other ggplot2 geom layers. The function has x, y, and label arguments which allow you to position the string/label at the desired coordinates.
Use what you have learned in the previous prac coding exercises and what you have learned about the geom_abline() and annotate() functions to produce the following plot. Use the equations above to generate the lines and the text outputs (20)
Application questions
Question 1
Describe how area of an island and the distance of the island from the mainland affect the rate that species will colonise the island (6)
Question 2
These models have some properties which do not appear to accurately model or represent the natural world exactly. Identify three of these properties and propose solutions as to how these problems could be overcome (6)
Question 3
Identify and describe five factors which play a role in the immigration rates in island biogeography theory (5)
Question 4
Island biogeography is not limited to only areas of land surrounded by water - several other kinds of islands exist. One important area where island biogeography theory can be applied is in managing conservation areas. As the average size of undisturbed areas declines due to increased rates of anthropogenic activities, migratory animals have a much more challenging task colonising new “islands” to maintain the species richness of those islands. Describe ways that conservation managers could help mitigate this problem (10)
Question 5
An important problem that islands often need to overcome is being invaded by alien species. Using your understanding of island biogeography theory describe how conservation managers could promote the presence of indigenous species and prevent the establishment of invasive species on islands (8)